一、前言
profiler 命令支持生成应用热点的火焰图。本质上是通过不断的采样,然后把收集到的采样结果生成火焰图。
目前 profiler 命令还不支持在 Windows 下执行。
1 | profiler list |
二、基本使用
profiler 命令基本运行结构是 profiler action [actionArg]
2.1 参数说明
| 参数名称 | 参数说明 |
|---|---|
| action | 要执行的操作 |
| actionArg | 属性名模式 |
| [i:] | 采样间隔(单位:ns)(默认值:10’000’000,即10 ms) |
| [f:] | 将输出转储到指定路径 |
| [d:] | 运行评测指定秒 |
| [e:] | 要跟踪哪个事件(cpu, alloc, lock, cache-misses等),默认是 cpu |
2.2 采样
(1)启动 profiler
1 | profiler start |
默认情况下,生成的是cpu的火焰图,即event为
cpu。可以用--event参数来指定。
(2)获取已采集的 sample 的数量
1 | profiler getSamples |
(3)查看 profiler 状态
可以查看当前 profiler 在采样哪种 event 和采样时间。
1 | profiler status |
(4)停止 profiler
默认情况下,生成的格式为 svg 格式,且生成的结果保存到应用的 工作目录 下的 arthas-output 目录。
1 | Started [cpu] profiling |
可以通过 --file 参数来指定输出结果路径。比如:
1 | profiler stop --file ./output.svg |
如果需要生成 html 格式的,可以用 --format 参数指定:
1 | profiler stop --format html |
2.3 渲染
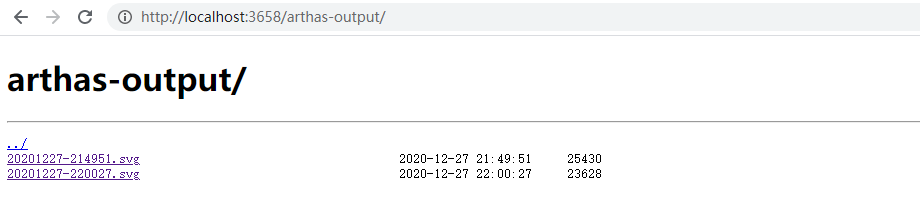
默认情况下,arthas使用3658端口,则可以打开: http://localhost:3658/arthas-output/ 查看到arthas-output目录下面的 profiler 结果,或者直接打开源文件即可。
2.4 event 支持
在不同的平台,不同的OS下面,支持的events各有不同。可以通过 profiler list 命令查询。
2.5 恢复采样
1 | profiler resume |
start和resume的区别是:start是新开始采样,resume会保留上次stop时的数据。
通过执行profiler getSamples可以查看 samples 的数量来验证。
2.6 framebuf 参数
如果遇到生成的svg图片有 [frame_buffer_overflow],则需要增大 framebuf(默认值是 1’000’000),可以显式配置,比如:
1 | profiler start --framebuf 5000000 |
2.7 过滤数据
如果应用比较复杂,生成的内容很多,想只关注部分数据,可以通过 include/exclude 来过滤。比如:
1 | profiler start --include 'java/*' --include 'demo/*' --exclude '*Unsafe.park*' |
include/exclude 都支持设置多个值 ,但是需要配置在命令行的最后。
2.8 指定执行时间
比如,希望 profiler 执行 300 秒自动结束,可以用 -d/--duration 参数指定:
1 | profiler start --duration 300 |
2.9 生成 jfr 格式结果
jfr 只支持在 start时配置。如果是在 stop 时指定,则不会生效。
1 | profiler start --file /tmp/test.jfr |
file参数支持一些变量:
- 时间戳:
--file /tmp/test-%t.jfr - 进程ID:
--file /tmp/test-%p.jfr
生成的结果可以用支持jfr格式的工具来查看。比如:
- JDK Mission Control : https://github.com/openjdk/jmc
- JProfiler : https://github.com/alibaba/arthas/issues/1416
三、火焰图分析
火焰图是基于 perf 结果产生的SVG 图片,用来展示 CPU 的调用栈。
-
y 轴表示调用栈,每一层都是一个函数。调用栈越深,火焰就越高,顶部就是正在执行的函数,下方都是它的父函数。
-
x 轴表示抽样数,如果一个函数在 x 轴占据的宽度越宽,就表示它被抽到的次数多,即执行的时间长。注意,x 轴不代表时间,而是所有的调用栈合并后,按字母顺序排列的。
火焰图就是看顶层的哪个函数占据的宽度最大。只要有"平顶"(plateaus),就表示该函数可能存在性能问题。
颜色没有特殊含义,因为火焰图表示的是 CPU 的繁忙程度,所以一般选择暖色调。
可以参考阮一峰的文章:http://www.ruanyifeng.com/blog/2017/09/flame-graph.html
 wechat
- alipay